| Multivariate Pattern Analysis in Python |
| Multivariate Pattern Analysis in Python |
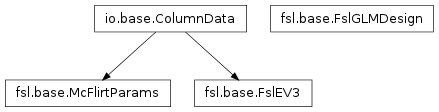
Inheritance diagram for mvpa.misc.fsl.base:
Tiny snippets to interface with FSL easily.
Bases: mvpa.misc.io.base.ColumnData
IO helper to read FSL’s EV3 files.
This is a three-column textfile format that is used to specify stimulation protocols for fMRI data analysis in FSL’s FEAT module.
Data is always read as float.
Read and write FSL EV3 files.
| Parameters: | source (filename of an EV3 file) – |
|---|
Returns a tuple of (onset time, simulus duration, intensity) for a certain EV.
Returns the number of EVs in the file.
Returns the number of EVs in the file.
Convert into a list of Event instances.
| Parameters: | kwargs – Any keyword arugment provided would be replicated, through all the entries. Useful to specify label or even a chunk |
|---|
Write data to a FSL EV3 file.
Bases: object
Load FSL GLM design matrices from file.
Be aware that such a desig matrix has its regressors in columns and the samples in its rows.
| Parameters: | source (filename) – Compressed files will be read as well, if their filename ends with ‘.gz’. |
|---|
Visualize the design matrix.
| Parameters: |
|
|---|
Bases: mvpa.misc.io.base.ColumnData
Read and write McFlirt’s motion estimation parameters from and to text files.
Initialize McFlirtParams
| Parameters: | source (str) – Filename of a parameter file. |
|---|
Produce a simple plot of the estimated translation and rotation parameters using.
You still need to can pylab.show() or pylab.savefig() if you want to see/get anything.
Returns the data as an array with six columns (same order as in file).
Write motion parameters to file.