| Multivariate Pattern Analysis in Python |
| Multivariate Pattern Analysis in Python |
This is an example demonstrating discovery of the distribution facility.
from mvpa.suite import *
verbose.level = 2
if __debug__:
# report useful debug information for the example
debug.active += ['STAT', 'STAT_']
report = Report(name='match_distribution_report',
title='PyMVPA Example: match_distribution.py')
verbose.handlers += [report] # Lets add verbose output to the report.
# Similar action could be done to 'debug'
#
# Figure for just normal distribution
#
# generate random signal from normal distribution
verbose(1, "Random signal with normal distribution")
data = N.random.normal(size=(1000, 1))
# find matching distributions
# NOTE: since kstest is broken in older versions of scipy
# p-roc testing is done here, which aims to minimize
# false positives/negatives while doing H0-testing
test = 'p-roc'
figsize = (15, 10)
verbose(1, "Find matching datasets")
matches = matchDistribution(data, test=test, p=0.05)
P.figure(figsize=figsize)
P.subplot(2, 1, 1)
plotDistributionMatches(data, matches, legend=1, nbest=5)
P.title('Normal: 5 best distributions')
P.subplot(2, 1, 2)
plotDistributionMatches(data, matches, nbest=5, p=0.05,
tail='any', legend=4)
P.title('Accept regions for two-tailed test')
# we are done with the figure -- add it to report
report.figure()
#
# Figure for fMRI data sample we have
#
verbose(1, "Load sample fMRI dataset")
attr = SampleAttributes(os.path.join(pymvpa_dataroot, 'attributes.txt'))
dataset = NiftiDataset(samples=os.path.join(pymvpa_dataroot, 'bold.nii.gz'),
labels=attr.labels,
chunks=attr.chunks,
mask=os.path.join(pymvpa_dataroot, 'mask.nii.gz'))
# select random voxel
dataset = dataset.selectFeatures(
[int(N.random.uniform()*dataset.nfeatures)])
verbose(2, "Minimal preprocessing to remove the bias per each voxel")
detrend(dataset, perchunk=True, model='linear')
zscore(dataset, perchunk=True, baselinelabels=[0],
targetdtype='float32')
# on all voxels at once, just for the sake of visualization
data = dataset.samples.ravel()
verbose(2, "Find matching distribution")
matches = matchDistribution(data, test=test, p=0.05)
P.figure(figsize=figsize)
P.subplot(2, 1, 1)
plotDistributionMatches(data, matches, legend=1, nbest=5)
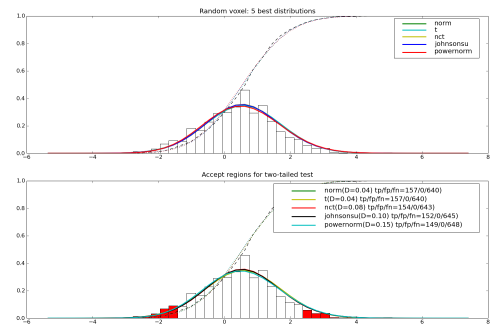
P.title('Random voxel: 5 best distributions')
P.subplot(2, 1, 2)
plotDistributionMatches(data, matches, nbest=5, p=0.05,
tail='any', legend=4)
P.title('Accept regions for two-tailed test')
report.figure()
if cfg.getboolean('examples', 'interactive', True):
# store the report
report.save()
# show the cool figure
P.show()
Example output for a random voxel is
See also
The full source code of this example is included in the PyMVPA source distribution (doc/examples/match_distribution.py).